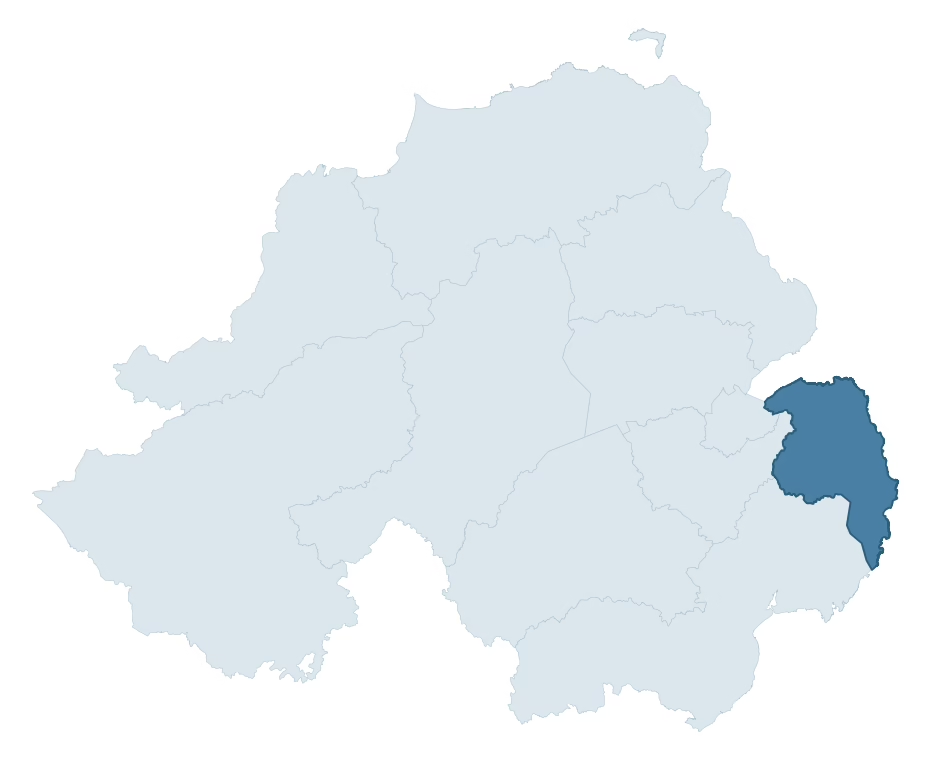
Ards and North Down comprises 40 of Northern Ireland's 462 electoral wards, covering 1,678 km² of land — roughly 8.7% of the NI ward total. Across these wards, the combined heritage record holds 1,070 recorded historic sites, 96 scheduled monuments, and 1,643 listed buildings, drawn from the NISMR, HED scheduled monuments register, and HED Historic Buildings Record. That places the council at the 2nd highest recorded heritage density of NI's eleven councils (0.69 sites per km²). The 2021 Census records 161,902 residents across the council's wards. The single richest ward in the council by recorded heritage is Killinchy (391 combined records); a complete ranked list of all 40 wards in this council appears below.
Heritage at a glance
Chronological character
Aggregated across the council's wards, the dated archaeological record contains 830 sites distributed across 9 archaeological periods. The Post Medieval period is the most common (258 sites, 31%), with the Iron Age period in second place (147 sites, 18%). Sparsely represented periods include Middle Late Bronze Age and Neolithic — each under 2% of the dated record. As elsewhere in NI, thin period coverage typically reflects survey gaps rather than genuine absence of activity. A further 240 sites (22% of the council's total record) carry an 'Unknown' period attribution and are excluded from the figures above.
Most common monument types
The table below lists the council’s most frequently recorded monument types, with the share they form of this council’s record compared to their share of the NI-wide record.
| Monument type | In this council | % of council | NI comparison |
|---|---|---|---|
| Enclosure | 48 | 18.3% | in line with NI average (0.7×) |
| Cleared Slipway | 23 | 8.8% | over-represented (9.8× NI average) |
| A.p. Site | 22 | 8.4% | over-represented (3.5× NI average) |
| Rath | 17 | 6.5% | under-represented (0.3× NI average) |
| Ford | 17 | 6.5% | over-represented (21.7× NI average) |
| Intertidal Wall | 16 | 6.1% | over-represented (8.7× NI average) |
Geographic character
Wards in this council average just 37m mean elevation — characteristic of low-lying landscapes, coastal plains, or river valleys. Land cover averages combine 40% grassland, 20% woodland and 25% urban land, giving a varied mosaic across the council's wards.
All wards in Ards and North Down
The complete list of 40 wards in this council. Click any ward to view its full heritage profile.
| Ward | HS | SM | LB | Total | km² | Dominant period |
|---|---|---|---|---|---|---|
| Killinchy | 272 | 15 | 104 | 391 | 226.4 | Post-Medieval |
| Portaferry | 85 | 11 | 168 | 264 | 124.7 | Early Medieval |
| Ballywalter | 102 | 12 | 106 | 220 | 159.6 | Mesolithic |
| Kircubbin | 131 | 11 | 75 | 217 | 185.2 | Post-Medieval |
| Carrowdore | 66 | 2 | 86 | 154 | 154.8 | Post-Medieval |
| Holywood | 10 | 3 | 137 | 150 | 14.6 | Early Medieval |
| Comber South | 52 | 5 | 74 | 131 | 103.9 | Iron Age |
| Conway Square | 16 | 3 | 111 | 130 | 9.6 | Modern |
| Cultra | 14 | 1 | 100 | 115 | 51.4 | Iron Age |
| Scrabo | 54 | 4 | 50 | 108 | 62.0 | Iron Age |
| Warren | 37 | 5 | 53 | 95 | 57.6 | Iron Age |
| Comber West | 20 | 2 | 71 | 93 | 26.3 | Iron Age |
| Loughries | 50 | 4 | 35 | 89 | 122.1 | Post-Medieval |
| Harbour | 2 | 0 | 80 | 82 | 3.7 | Post-Medieval |
| Helen's Bay | 16 | 0 | 64 | 80 | 24.6 | Iron Age |
| Ballygowan | 25 | 2 | 43 | 70 | 79.7 | Iron Age |
| Clandeboye | 23 | 2 | 44 | 69 | 44.7 | Early Medieval |
| Donaghadee | 2 | 0 | 47 | 49 | 4.7 | Early Medieval |
| Loughview | 3 | 0 | 45 | 48 | 14.4 | Post-Medieval |
| Groomsport | 16 | 0 | 25 | 41 | 20.1 | Early Medieval |
| Portavogie | 18 | 2 | 17 | 37 | 54.3 | Iron Age |
| Comber North | 21 | 2 | 9 | 32 | 17.3 | Iron Age |
| Glen | 7 | 5 | 10 | 22 | 18.6 | Post-Medieval |
| Ballyholme | 2 | 0 | 15 | 17 | 3.2 | Iron Age |
| Ballygrainey | 2 | 0 | 14 | 16 | 21.5 | Post-Medieval |
| Castle | 3 | 1 | 12 | 16 | 4.9 | Early Bronze Age |
| West Winds | 6 | 0 | 7 | 13 | 19.1 | Mesolithic |
| Broadway | 1 | 1 | 10 | 12 | 4.5 | Modern |
| Bryansburn | 0 | 0 | 12 | 12 | 3.8 | Unknown |
| Ballycrochan | 4 | 1 | 2 | 7 | 7.2 | Iron Age |
| Movilla | 1 | 0 | 5 | 6 | 3.6 | Early Medieval |
| Rathgael | 2 | 1 | 3 | 6 | 3.5 | Modern |
| Rathmore | 1 | 0 | 5 | 6 | 3.8 | Early Medieval |
| Ballymagee | 3 | 1 | 0 | 4 | 3.6 | Early Medieval |
| Gregstown | 1 | 0 | 3 | 4 | 3.5 | Modern |
| Bloomfield | 2 | 0 | 0 | 2 | 4.5 | Post-Medieval |
| Cronstown | 0 | 0 | 1 | 1 | 3.4 | Unknown |
| Kilcooley | 0 | 0 | 0 | 0 | 3.4 | Unknown |
| Silverbirch | 0 | 0 | 0 | 0 | 2.5 | Unknown |
| Silverstream | 0 | 0 | 0 | 0 | 2.2 | Unknown |
Browse other Northern Ireland councils

Want a deeper view?
Grounding History: 10 Maps of Northern Ireland’s Past
A spatial history report bringing together analysis of all 462 wards into one place through 10 high-quality maps — covering monument density, archaeological periods, placename heritage, terrain, wetland, and the historic landscape at first survey.
About this profile
This council profile aggregates the recorded archaeological, built-heritage, terrain, and population data from each of its 40 wards. All figures describe the recorded evidence held in the public datasets listed at the foot of this page; the profile does not interpret historical processes or make inferences that are not directly supported by the data.
For full methodology — including a description of the ward geography, what counts as a recorded site, how period attributions are made, and what the limits of survey coverage mean for these figures — see the main methodology page.