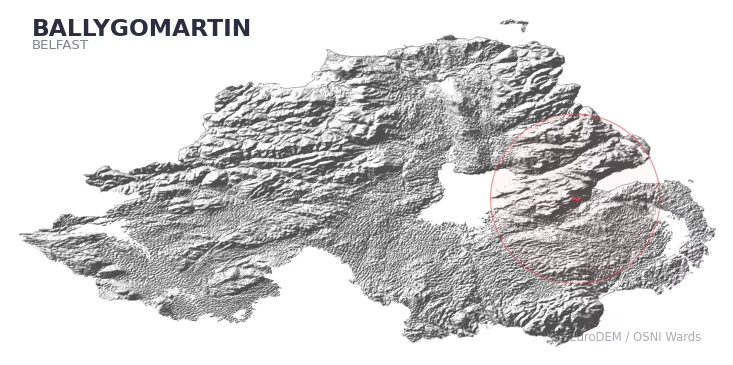
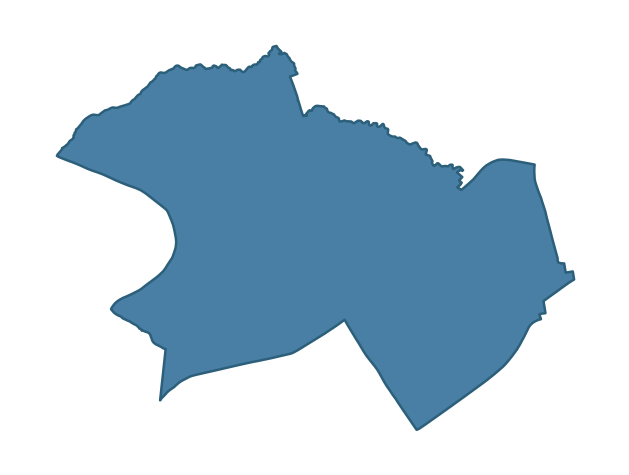
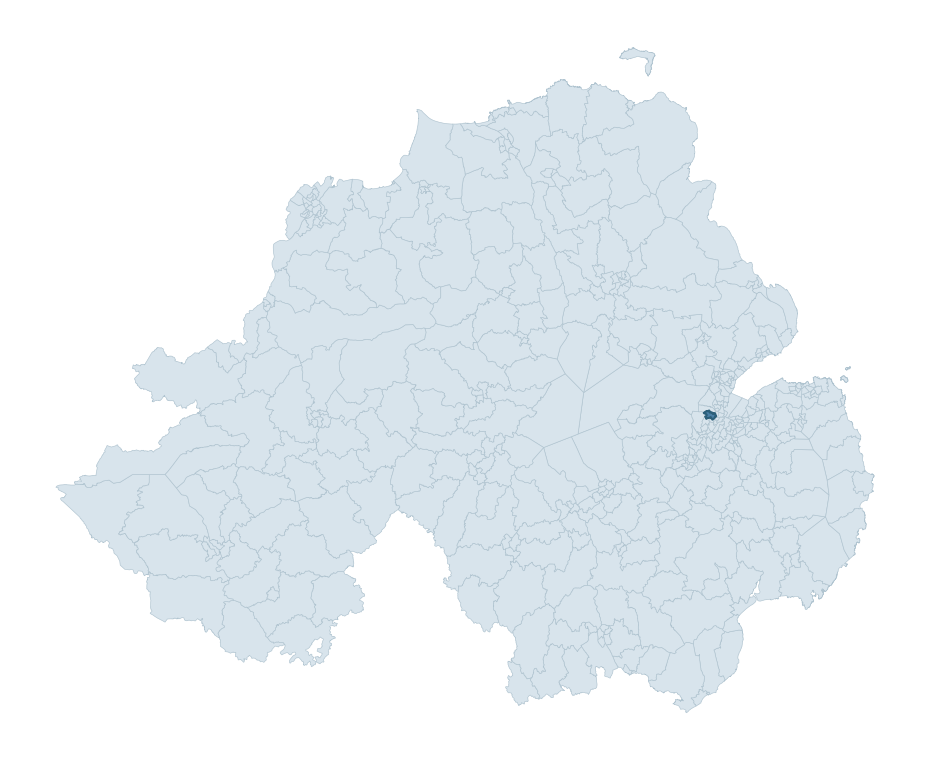
BALLYGOMARTIN covers 8.2 km² in Northern Ireland. With 4 historic sites and 0 scheduled monuments on record, the ward sits at the 9th percentile across all 462 NI wards for combined archaeological heritage. Per 1,000 residents, this works out at 0.7 recorded sites — the 6th percentile across NI wards (a measure of heritage density relative to current population). Dated archaeological evidence runs from the Mesolithic through to the Iron Age period, spanning 2 archaeological periods, the 22nd percentile across NI wards (a relatively narrow chronological band). The recorded total is low relative to the ward's area. In Northern Ireland this typically reflects limits of survey coverage rather than a genuine absence of past activity.
Heritage at a glance
Percentile rankings throughout this profile compare each ward only against the other 461 Northern Ireland wards.
Population context
The recorded heritage of BALLYGOMARTIN
Of the 4 historic sites recorded, the most common are Flint Knapping Site: Flint Factory (1, 25% of historic sites), Enclosure (1), and A.P. Site – Large Circular Cropmark (1). For Flint Knapping Site: Flint Factorys, this is the 0th percentile across NI wards that record this type. For Enclosures, this is the 0th percentile across NI wards that record this type. Across the ward's 8.2 km², this gives a recorded density of 0.49 sites per km² (all heritage types combined).
Most common monument types
| Type | Count | Description |
|---|---|---|
| Flint Knapping Site: Flint Factory | 1 | — |
| Enclosure | 1 | — |
| A.p. Site – Large Circular Cropmark | 1 | — |
Chronological distribution
Note: 25% of historic site records carry an ‘Unknown’ period attribution. The chronological breakdown above reflects only the dated subset.
Terrain and environment
With a mean elevation of 130m, this ward sits above the NI median (84th percentile), but the ward reaches 368m at its highest point — a vertical span of more than 238m within its boundary, indicating significant topographic diversity. The terrain is consistently steep, with a mean slope of 9.8° (98th percentile across NI); localised maximum slopes reach 27°, typical of stream-cut valleys, escarpments, or bluffs within the wider landscape. The ward is well-drained, with a Topographic Wetness Index of 8.9 (1th NI percentile) — characteristic of upland or steeply-sloping ground that sheds water rapidly. The land-cover mosaic combines woodland (41%), improved grassland (32%), and urban land (26%), giving a mixed agricultural and semi-natural landscape. In overall character, this is an upland landscape of steep, elevated terrain, with land use dominated by woodland.
Terrain measurements
Where this ward sits in NI
Geology and preservation
The dominant bedrock formed during the Mesozoic era (Triassic period). Rock formed during the age of dinosaurs; in NI this typically appears as Triassic mudstones and Jurassic clays now buried beneath younger deposits. Bedrock composition is moderately varied (complexity index 0.63), with two or three geological units present within the ward boundary.
Placename evidence
This ward has only 7 placenames recorded across OSNI, Logainm NI, and GeoNames, none of which fall into the diagnostic categories used for heritage analysis (ecclesiastical, defensive, Norse, Anglo-Norman, or Plantation-era). The remainder are generic Gaelic landscape forms that are common across Ireland and carry no specific period signal.
Recorded historic sites
| Name | Period | Type |
|---|---|---|
| A.P. SITE – large circular cropmark | Unknown | Unknown |
| ENCLOSURE | Iron Age | Unknown |
| FLINT KNAPPING SITE: FLINT FACTORY | Mesolithic | Industrial |
| SQUARE ENCLOSURE & FIELD BANKS | Iron Age | Commercial |
Discover more in Belfast
- Knock
- Andersonstown
- Ballymurphy
- Finaghy
- Woodvale
- Belmont
- Twinbrook
- Bloomfield — Ards and North Down
- Ballymacarrett
- Ballynure — Antrim and Newtownabbey
See all 462 wards in the Northern Ireland Heritage Tool.

Want a deeper view?
Grounding History: 10 Maps of Northern Ireland’s Past
A spatial history report bringing together analysis of all 462 wards into one place through 10 high-quality maps — covering monument density, archaeological periods, placename heritage, terrain, wetland, and the historic landscape at first survey.
About this profile
What is a ward?
A ward is the smallest electoral and statistical geography used by the Northern Ireland Statistics and Research Agency (NISRA). The boundaries used here are the 2014 NISRA / OSNI Wards (462 across Northern Ireland), each typically covering 1-700 km² and a population of a few thousand. Wards do not align with parishes, townlands, or any historic administrative unit — they are a modern statistical convenience, used here only as a fixed spatial frame within which to summarise heritage records.
What counts as a site?
Three distinct heritage record types are reported separately, not combined: (1) Historic Sites — entries in the Northern Ireland Sites and Monuments Record (NISMR), the inventory of recorded archaeological sites and findspots, dated from prehistoric to early-modern; (2) Scheduled Monuments — sites legally protected under the Historic Monuments and Archaeological Objects (NI) Order 1995 and maintained by the Historic Environment Division (HED); (3) Listed Buildings — buildings of architectural or historic interest protected under the Planning Act (NI) 2011 and graded A, B+, B1, B2, or Record-Only by HED. A site appearing in more than one register is counted in each register independently.
Editorial principles
These ward profiles describe evidence, not history. They report what is recorded, not what occurred. Where the data is ambiguous, we say so. We do not infer historical processes — population movements, settlement expansion, periods of decline — from patterns in the record. Absence of evidence is not evidence of absence: in Northern Ireland, where antiquarian survey was uneven and modern excavation is geographically biased, a gap in the record almost always reflects the limits of recording rather than a genuine historical absence. We mark such gaps explicitly where they appear in the data.
Limits of coverage and known caveats
Several caveats apply to every ward profile: (1) NISMR coverage is uneven across NI — some areas (notably parts of the south-east and the Belfast urban fringe) have been more intensively surveyed than others, so a low recorded site count does not reliably indicate a low past density of activity; (2) period attributions in NISMR are often 'Unknown', and chronological breakdowns reported here reflect only the dated subset; (3) placename classification depends on the Irish-language form (name_ga), which is recorded for approximately 50% of NI placenames in the combined sources, so ecclesiastical and pre-Christian counts may be understated where anglicised forms remain unparsed; (4) terrain percentile ranks compare each ward only to the other 461 NI wards; they are not absolute thresholds. For absence-dominant land cover categories (wetland, water, cropland), percentile ranks are suppressed below 1% raw value, since the ranking of zero-value wards is not meaningful.
Data sources (11)
- Northern Ireland Sites and Monuments Record (NISMR) https://www.communities-ni.gov.uk/articles/nismr-public-mapviewer
- HED Scheduled Monuments Dataset https://www.opendatani.gov.uk/@historic-environment-division/scheduled-monuments-northern-ireland
- HED Historic Buildings Record https://www.communities-ni.gov.uk/topics/historic-environment/listed-buildings
- OSNI OS Open Names (Northern Ireland) https://www.opendatani.gov.uk/@ordnance-survey-of-northern-ireland/osni-open-data—50k-gazetteer
- Logainm — Placenames Database of Ireland https://www.logainm.ie/
- GeoNames https://www.geonames.org/
- Census 2021 (Northern Ireland) https://www.nisra.gov.uk/statistics/2021-census
- OSNI Open Data — Largescale Boundaries https://www.opendatani.gov.uk/@ordnance-survey-of-northern-ireland/osni-open-data-largescale-boundaries-wards-2012
- Copernicus GLO-30 DEM https://spacedata.copernicus.eu/collections/copernicus-digital-elevation-model
- ESA WorldCover https://esa-worldcover.org/
- GSNI 1:250,000 Geology https://www.bgs.ac.uk/geological-data/maps/